

Click to Skip Ahead
Note: This article’s statistics come from third-party sources and do not represent the opinions of this website.
Americans have a great love of animals and devote a great deal of time and energy to taking care of their pets. That should be no surprise! Our beloved pets are important members of our families. They give us companionship, entertainment, exercise, love, and comfort.
We researched the most popular pets in the U.S. and a look at how this breaks down across demographics and the different states. We’ll start with a look at the top eight pets and branch out from there.
We hope these numbers will give you a little insight into how important pets are to Americans.
 The 20 Pets Statistics
 The 20 Pets Statistics
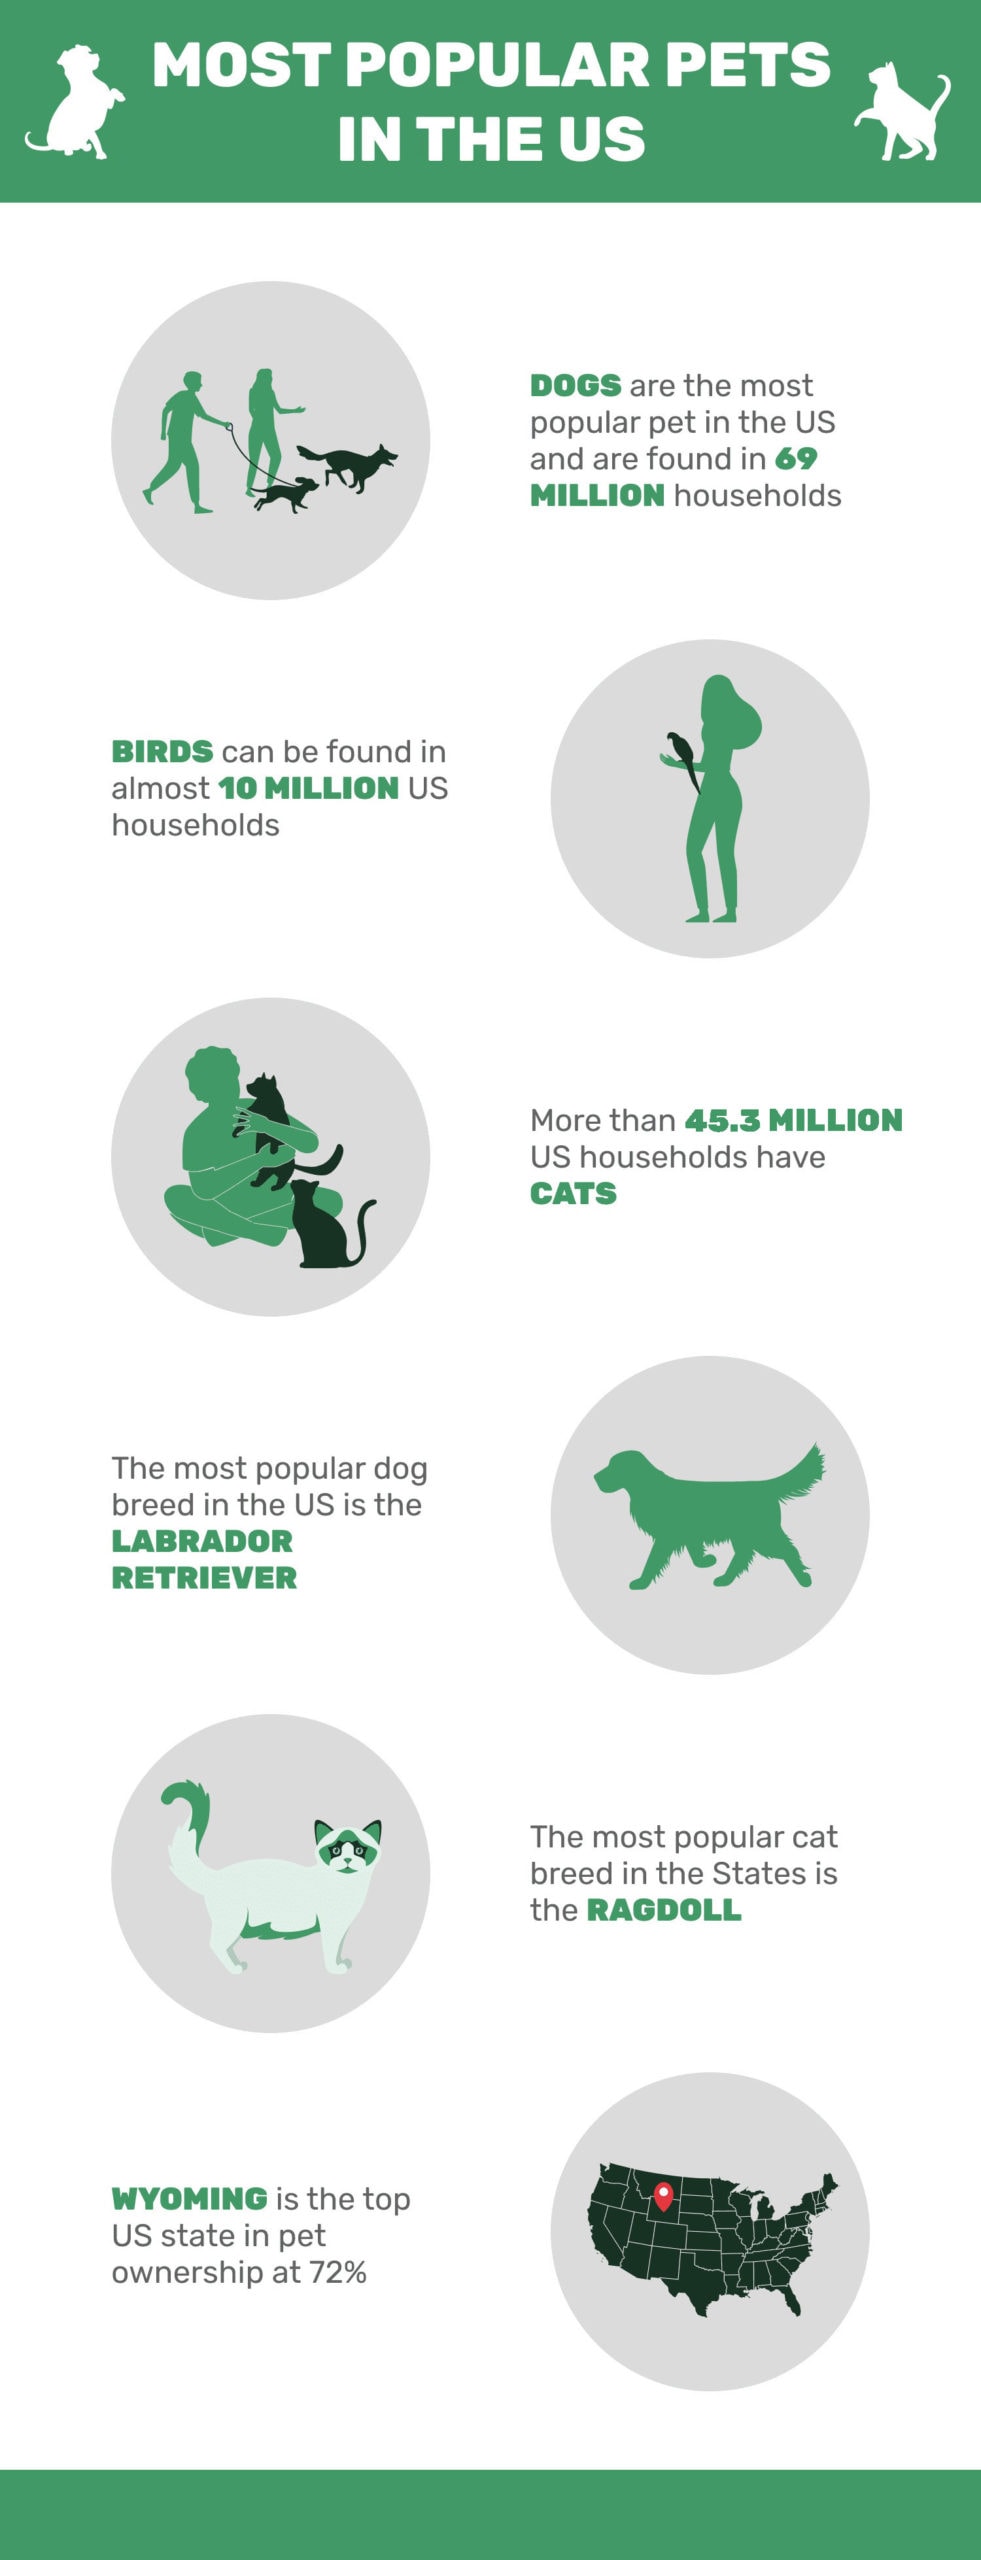
- Dogs are the most popular pet and are found in 69 million U.S. households.
- 45.3 million households have cats.
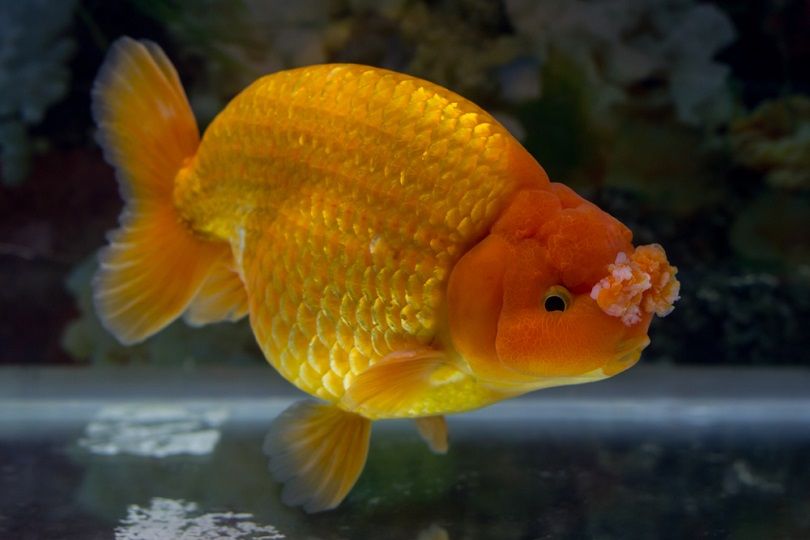
- 11.8 million U.S. households have freshwater fish.
- Birds can be found in 9.9 million U.S. households.
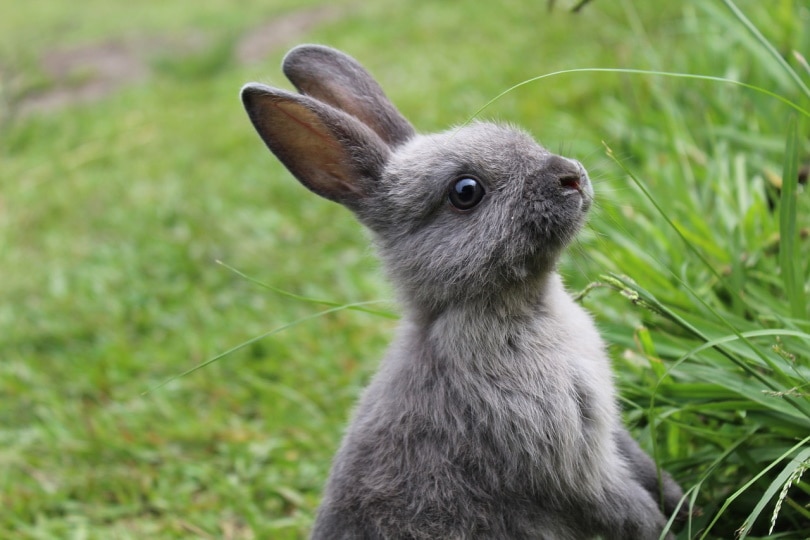
- Small animals can be found in 6.2 million American homes.
- 5.7 million U.S. households own reptiles.
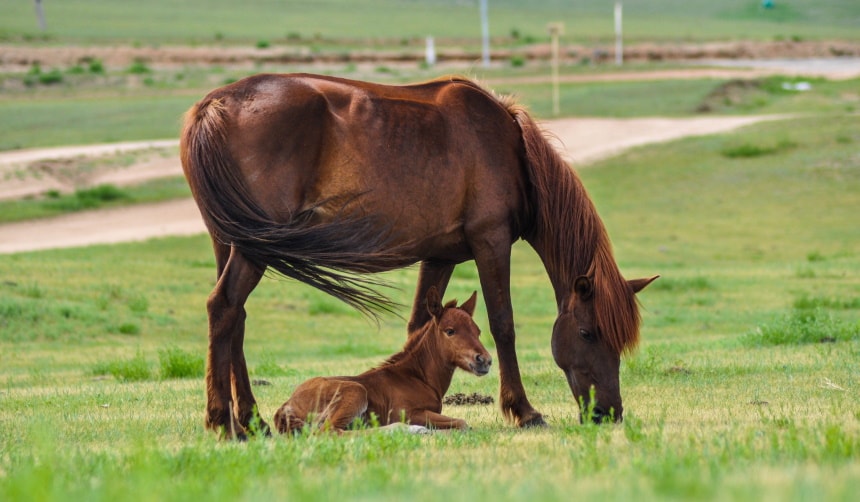
- 3.5 million homes own horses.
- Saltwater fish can be found in 2.9 million U.S. households.
- Wyoming is the top state in pet ownership at 72%.
- The District of Columbia has the lowest number of pet-owning households at 38%.
- Idaho had the most dog owners at 58%.
- Vermont had the highest percentage of cats at 45%.
- The most Google-searched dog in the U.S. was the Doberman.
- The millennial age group is the largest number of pet owners at 32%.
- Millennials spend more on their pets over the holidays, with an average of $51.
- Dog owners spend around $1,201 annually, while cat owners spend about $687.
- 79% of American pet owners think that their pets are their best friends.
- 89% of pet owners said that their pets have brought them comfort during the COVID-19 pandemic.
- The most popular cat breed in the States is the Ragdoll.
- The most popular dog breed in the States is the Labrador Retriever.

Most Popular Pets Statistics
1. Dogs are the most popular pet and are found in 69 million U.S. households.
(APPA)
The most common pets in the U.S. are unsurprisingly dogs. Approximately 69 million American households had at least one dog in 2021–2022.

2. 45.3 million households have cats.
(APPA)
Just as unsurprisingly, cats come in second as the most popular pet, with 45.3 million U.S. households owning a furry feline.
3. 11.8 million U.S. households have freshwater fish.
(APPA)
Perhaps this is a surprise, but 11.8 million American households own freshwater fish.
4. Birds can be found in 9.9 million U.S. households.
(APPA)
In fourth place, we find that 9.9 million American homes own birds.
5. Small animals can be found in 6.2 million American homes.
(APPA)
The fifth most common kind of pet in U.S. homes is small animals. We don’t have a breakdown of what the most popular small animals are, but we can assume that rabbits, hamsters, and guinea pigs top the list.
6. 5.7 million U.S. households own reptiles.
(APPA)
Reptiles are the sixth most common pet in the U.S., with 5.7 million homes owning a reptile. Like the small animals, we don’t know the breakdown of what kinds of reptiles are the most popular, but snakes are likely the top candidates, along with lizards and turtles.
7. 3.5 million homes own horses.
(APPA)
Coming in as the seventh most popular pet are horses. 3.5 million homes own a horse, whether keeping them at their own ranch or boarding them at a stable.
8. Saltwater fish can be found in 2.9 million U.S. households.
(APPA)
Saltwater fish are the eighth most popular pet in America. They are higher maintenance, which might account for their being less popular than the rest.
 Popular Pets by States Statistics
 Popular Pets by States Statistics
9. Wyoming is the top state in pet ownership at 72%.
(AVMA)
As of 2016, Wyoming had the highest number of households that owned pets, which was followed by West Virginia at 71% and Nebraska at 70%.

10. The District of Columbia has the lowest number of pet-owning households at 38%.
(AVMA)
The District of Columbia had the lowest rate of pet-owning households at 38%, followed by Rhode Island at 45.4% and South Dakota at 46.4%.
11. Idaho had the most dog owners at 58%.
(AVMA)
This is followed by Montana at 52%, Arkansas at 52%, and Mississippi at 51%. It’s thought that more dog owners tend to be in the warmer, rural states, although there are plenty of dogs in the colder states.

12. Vermont had the highest percentage of cats at 45%.
(AVMA)
Maine came in second at 44%, West Virginia at 38%, and Indiana also at 38%. Many of the cat-owning states tend to be the colder ones.
13. The most Google searched dog in the U.S. was the Doberman.
(Franchise Opportunities)
These numbers come from the 2017 Google Trends data for the most popular or most searched dog breed in each state. The Doberman Pinscher was the most popular, being the most searched in seven states. The French Bulldog came in second as most popular in five states and the Rottweiler in three states.

Pet Owner Statistics
14. The millennial age group is the largest number of pet owners at 32%.
(Statista)
Millennials are people born between 1981 and 1996 and are the age group that owns the most pets. After the Millennials are the Baby Boomers (born between 1946 and 1964) at 27%. They are followed by Gen X (born between 1965 and 1980) coming in third at 24%.
15. Millennials spend more on their pets over the holidays, with an average of $51.
(Statista)

Millennials own the most pets and tend to spend the most on their pets over the holidays with an average of $51. This compares to the baby boomer’s average of $28.
16. Dog owners spend around $1,201 annually, while cat owners spend about $687.
(Money.com)
On dog food alone, dog owners spent about $442, while cat owners spent about $329 on cat food in 2020.
17. 79% of American pet owners think that their pets are their best friends.
(Money.com)
The numbers are high across all of the age groups: Millennials at 79% and both Gen X and Baby Boomers at 78%.
18. 89% of pet owners said that their pets have brought them comfort during the COVID-19 pandemic.
(Money.com)
Across the generations, 84% were Millennials, 87% were Gen X, and 95% were Baby Boomers.
19. The most popular cat breed in the States is the Ragdoll.
(CFA)

The Ragdoll breed was the most popular in 2020 for the second year in a row. It was followed by the Exotic in second place and the Maine Coon in third.
20. The most popular dog breed in the States is the Labrador Retriever.
(AKC)
The Labrador Retriever has been the most popular dog in the U.S. since 1991. That’s over 30 years! Labs also top the list in many other countries around the world.

Frequently Asked Questions About Pet Ownership in the U.S.
How many American households have pets?
A whopping 70% of Americans own a pet in 2021–2022! This works out to about 90.5 million homes that have some kind of pet. This number has gone up from 56% in 1988 and 67% in 2019–2020. (APPA)
How much do Americans spend on their pets in a year?
Americans spent $103.6 billion on their pets in 2020: $42 billion on pet food and treats, $22.1 billion purchasing new pets and supplies, $31.4 billion on vet care and vet products, and $8.1 billion on other services. These conclude insurance, grooming, boarding, training, and pet walking and sitting. (APPA)
How much was it estimated that was spent on pets in 2021?
It was estimated that $109.3 billion was spent in 2021. That’s $6 billion more than the previous year. (APPA)

How has the COVID-19 pandemic impacted how Americans bring home new pets?
In December 2020, 10% of Americans stated that they acquired new pets because of the pandemic. (Statista)
Where do most Americans get their pets?
The most common place that Americans find their new cats is at an animal shelter or Humane Society, at 31%. However, 34% of dogs are typically purchased from a breeder. (ASPCA)
Final Thoughts
Our beloved pets mean everything to us, and these statistics truly highlight this. During difficult times, pets can provide us with much-needed love and companionship and save us from a truly challenging time.
Dogs are usually the most popular kind of pet across the country, but that preference can range between cats and dogs, depending on the state. We suspect that it has something to do with urban versus rural, as well as temperature. After all, if you live in a frigid part of the country, taking your dog out several times a day isn’t most people’s idea of a good time.
The statistics that we see today will constantly change depending on what is going on in the country and the world. The pandemic has had a significant impact on pet ownership, and when things eventually return to normal, we’ll probably see more changes. But no matter what happens, as long as we cherish our pets, they will always give us their unconditional love and devotion.
Featured Image Credit: LightField Studios, Shutterstock


