

Click to Skip Ahead
Note: This article’s statistics come from third-party sources and do not represent the opinions of this website.
As the home of Silicon Valley, Hollywood, and some of the most famous national parks in the country, California might just be the state everyone knows about outside the United States. Like other parts of the country, California has many pets, but possibly not as many as you might think. In this article, you’ll learn 14 pet ownership statistics about California, including some you may find surprising.

The 14 California Pet Ownership Statistics
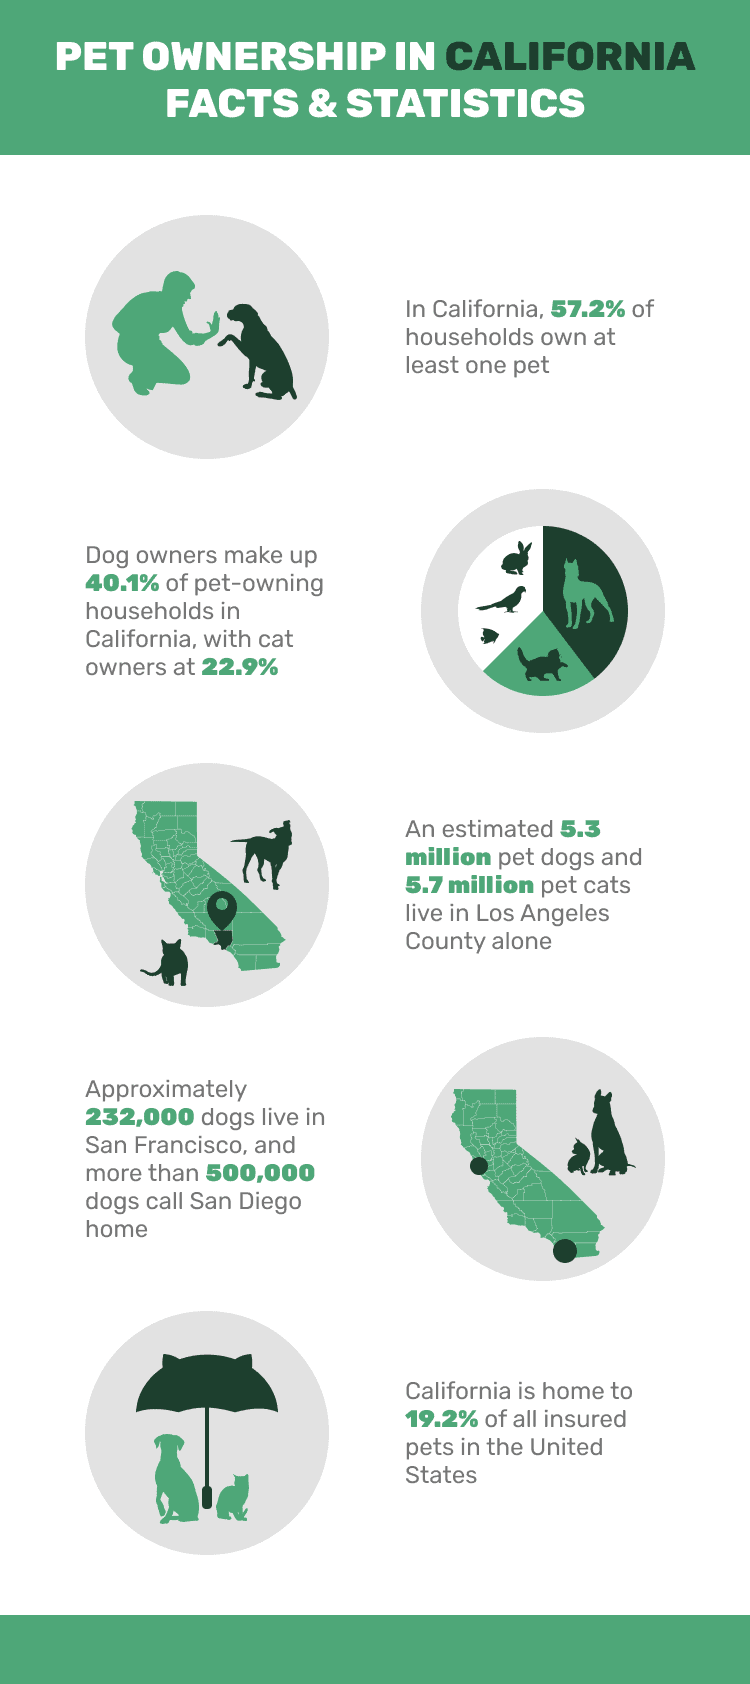
- In California, 57.2% of households own at least one pet.
- Dog owners make up 40.1% of pet-owning households in California.
- Cat owners are 22.9% of the pet-owning population in California.
- An estimated 5.3 million pet dogs and 5.7 million pet cats live in Los Angeles County.
- Approximately 232,000 dogs live in San Francisco.
- More than 500,000 dogs call San Diego home.
- The most popular dog name in California is Bella.
- In 2021–2022, 6,691 homeless pets entered the San Francisco Animal Care and Control shelters.
- In 2021–2022, 28,117 homeless pets were received by all Los Angeles County animal care and control shelters.
- An estimated 5–10% of the unhoused population of Los Angeles owns pets.
- The average cost of a vet visit for one pet in California is $71.95.
- The average dog-related injury insurance claim in California is $78, 818.
- The average pet insurance claim payout in California is $578.
- California is home to 19.2% of all insured pets in the United States.

How Many Pets Live in California?
1. In California, 57.2% of households own at least one pet.
(World Population Review)
While this may seem like a high percentage, it’s slightly lower than the estimated national average of 59%. California ranks in the bottom half of states when it comes to the percentage of pet ownership. In contrast, the highest is Wyoming, where 71.8% of households own at least one pet. The lowest is the District of Columbia, where 38.2% of homes have a pet.

2. Dog owners make up 40.1% of pet-owning households in California.
(World Population Review)
On this statistic, California skews close to the national average, with around 40% of U.S. households owning a dog. California households own an average of 1.6 dogs each, indicating that many are multi-dog families.
3. Cat owners are 22.9% of the pet-owning population in California.
(World Population Review)
Nationally, 27.8% of all households own cats, so California feline owners lag behind the average. In total, California households own an average of 1.7 cats.

4. An estimated 5.3 million pet dogs and 5.7 million pet cats live in Los Angeles County.
(Los Angeles Almanac)
An estimated 1.9 million of the 3.3 million households in Los Angeles County own a pet. After dogs and cats, fish are the next most popular pet in the county. Approximately 277,453 households in the county own fish.
5. Approximately 232,000 dogs live in San Francisco.
(San Francisco Magazine)
According to several estimates, San Francisco has a higher population of dogs than children. However, an accurate account of the canine population is hard to come by because not all dogs in San Francisco are properly licensed. Human census data suggests there are just over 18,000 minors in the city.

6. More than 500,000 dogs call San Diego home.
(NBC7 San Diego)
As one of the most dog-friendly cities in the state, San Diego is home to over half a million dogs. With multiple dog beaches, hiking, parks, and other outdoor activities, San Diego provides beautiful weather and plenty to keep them busy.
7. The most popular dog name in California is Bella.
(KESQ)
Dogs named Bella make up 5.47% of the top 50 dog names in the state. Bella is also the most popular dog name in the United States. Rounding out the top 5 are Luna, Max, Charlie, and Coco.

Homeless Pet Statistics in California
8. In 2021-2022, 6,691 homeless pets entered the San Francisco Animal Care and Control shelters.
(San Francisco Animal Care and Control)
As an open-door shelter, San Francisco Animal Care and Control accepts all surrendered, stray, and homeless pets, no questions asked. The total breakdown of animals admitted to the shelter comes to 2,232 cats, 1,974 dogs, and 2,485 other pets. Of these admissions, 92% left the shelter alive, either adopted, fostered, or reunited with their owners.
9. In 2021–2022, 28,117 homeless pets were received by all Los Angeles County animal care and control shelters.
(Los Angeles Animal Care and Control)
Most pets who entered the Los Angeles County animal shelters were picked up as strays, accounting for 72.53% of the total. An additional 20.19% were owner surrenders, and the remaining 7.29% entered the shelter in various other ways.

10. An estimated 5-10% of the unhoused population of Los Angeles owns pets.
(Spectrum News)
Los Angeles County is home to over 69,000 unhoused people. Many shelters don’t allow pets, leading them to choose between their animal companions or a safe sleeping spot. Recently, the state government passed a bill to encourage more homeless shelters to allow pets.
 The Cost of Pet Ownership in California
11. The average cost of a vet visit for one pet in California is $71.95.
(Forbes)
Nationwide, the average cost of a vet visit for one pet is about $61. For two pets, the average cost of a vet visit jumps to $108.39.
(Insurance Journal)
In 2022 in the United States, the average dog injury insurance claim was $65,555. California also had the most injury claims filed of any state at 1,954. Overall, the national average of insurance payouts rose 31.7% from 2021.

13. The average pet insurance claim payout in California is $578.
(ManyPets)
According to ManyPets, California has the highest average insurance payout of any state. The national average is $399 per claim. Montana has the lowest state average: $238 per claim.
14. California is home to 19.2% of all insured pets in the United States.
(ManyPets)
Given what we’ve learned about the cost of vet care in California, it’s probably no surprise that the state is also home to the highest percentage of insured pets in the country. That’s more than double the next closest state, New York, at 8.7%.
Frequently Asked Questions
What Are the Most Popular Dog Breeds in California?
Currently, the most popular registered dog breed in America is the French Bulldog. However, the most popular breed in California continues to be the Labrador Retriever. The rest of the top 5 includes the German Shepherd, Golden Retriever, Goldendoodle, and Chihuahua. (KRON)

What Pets Are Illegal in California?
The California Department of Fish and Wildlife provides an extensive list of species that are illegal to keep as pets in California without a permit. Animals that are prohibited include bats, hedgehogs, elephants, sloths, anteaters, crocodiles, and marine toads. You need a permit to transport or keep these and many other species (CA Dept of Wildlife.)
What Are the Entrance Requirements to Bring a Dog or Cat to California?
Dogs over the age of 4 months must have proof of rabies vaccination. If the dog is sold to a new owner, they must show a health certificate dated within 10 days of entry. Cats need neither proof of rabies vaccination nor a health certificate unless required by an airline to fly (CDFA.)
Is It Hard to Find Pet-Friendly Housing in California?
Overall, it’s hard to find affordable housing in California. Six California cities are listed as the top 10 most expensive rental markets in the country. Cities like Los Angeles encourage landlords to offer pet-friendly housing to improve their chances of finding renters. California has also passed laws to support pet-friendly accommodations, including requiring low-income housing to allow pets (KTLA.)

Conclusion
With a diverse landscape and countless opportunities for outdoor activities, California seems like the perfect state for pet owners. However, the high cost of living, including pet ownership, may be responsible for the state’s lower ranking for the number of pet-owning households. If you’re a California resident considering getting a pet, do your research and be aware of how much it will cost to do so first. Depending on your pet, you could face a decade or more of care costs.
See also:
Featured Image Credit: Prostock-studio, Shutterstock


